
Tutorial: Points Model Board
The Points Model is the board to start with in BasketballPredict: every player on tonight's slate with a points projection, the market's line, the side the model leans toward and a grade. This walkthrough explains each column, how to scope the slate and filter it, what the Ladders button opens, and what the Threes and Stats tabs add, so the board reads like a story instead of a spreadsheet. The same board layout is used on the Rebounds, Assists and Combos models, so what you learn here carries over.
What's covered
What the Points Model is
Getting there and choosing the date
Narrowing the slate with game chips
Reading a row: projection, line, side, grade and probability
Floor, ceiling and the Ladders button
The market columns: consensus odds, EV and best book
Filters, tags and columns
The Threes and Stats tabs
The player modal, tab by tab
What the Points Model is
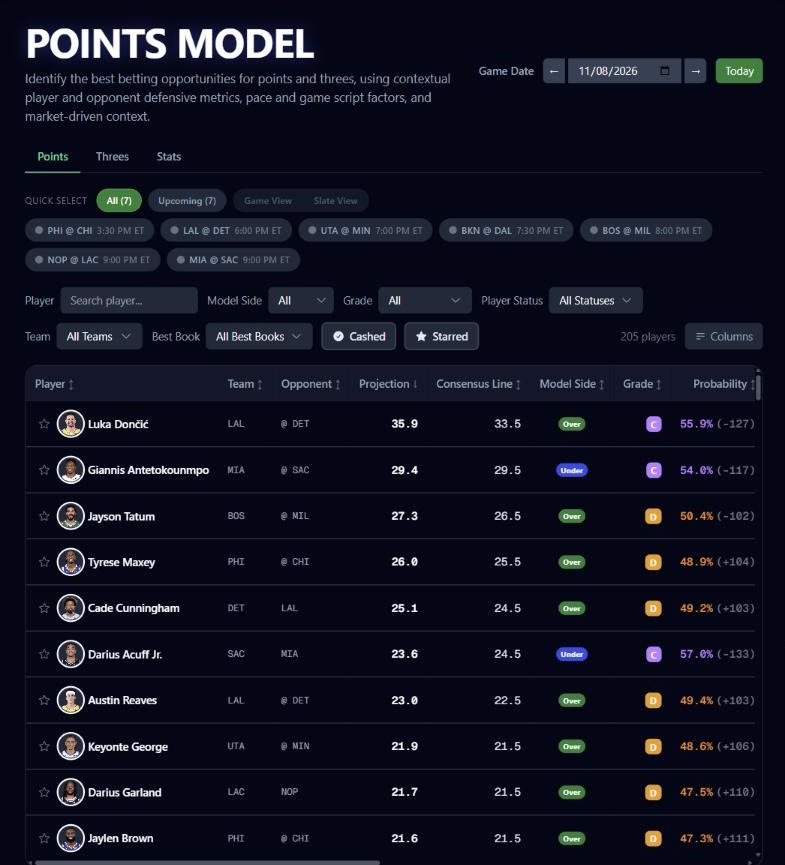
The page has three tabs: Points, Threes and Stats. Points opens first. Each row is one player in one of tonight's games, with a projected point total set beside the market's main line and the side (Over or Under) the model leans toward. The board opens sorted by projection, highest first.
Getting there and choosing the date
Open the sidebar and choose Points Model under Player Tools. The basketball slate is a night of games, so the control in the top right is a date selector: step back or forward a day, or jump to today. The date stays in place as you switch tabs.
Narrowing the slate with game chips
Above the table is a row of game chips, one per game on the date. Click a chip to show only that game, click several to compare, or click All to clear the selection. Once games are selected, a Game View and Slate View toggle lets you choose between a table split by game and one flat table across the selected games.
Reading a row
The Player cell
The first column holds a star, a headshot and the player's name. Click the name to open the player modal. Once a game is final, a result badge beside the name shows whether the model's side cashed. Your matching custom tags sit on their own line under the name.
Team, Opponent, Projection and Consensus Line
Team and Opponent give the matchup, with an at sign before the opponent for a road game. Projection is the projected point total. Consensus Line is the market's main points line for the player.
Model Side, Grade, Probability and Over Probability
Model Side is a badge reading Over or Under: the side the model leans toward at the consensus line.
Grade is the letter for the play, from A+ down.
Probability is the chance that the model's side clears the line, tinted to match the grade and shown with its equivalent American price.
Over Probability is the chance of the Over, whichever side the model leans toward.
Game Status and Player Status
Game Status shows the tip-off time in ET until the game is under way. Player Status shows the injury report designation. Rows for games that are over or will not be played are pinned to the bottom and dimmed.
Floor, ceiling and the Ladders button
Floor and Ceiling give the low and high ends of the projected range for the player.
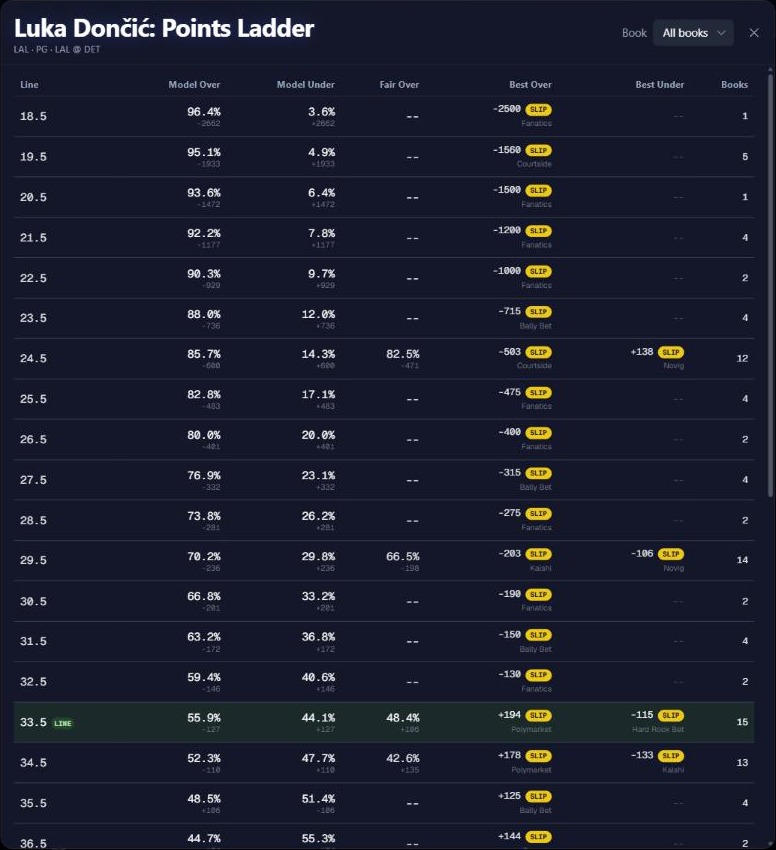
When the books post more than one line for a player, the Ladders column shows a button such as "5 lines". Click it to open a table of every posted line for that player, with the model's probability for each side and the market's price at each.
The market columns
Consensus Odds is the market's consensus price for the model's side at the main line.
EV % is the expected value of the model's side at the best price.
Best Book shows the best available price for that side and the sportsbook offering it.
Filters, tags and columns
The toolbar narrows the board; on a phone it collapses behind a Filters button.
Player search finds a player by name.
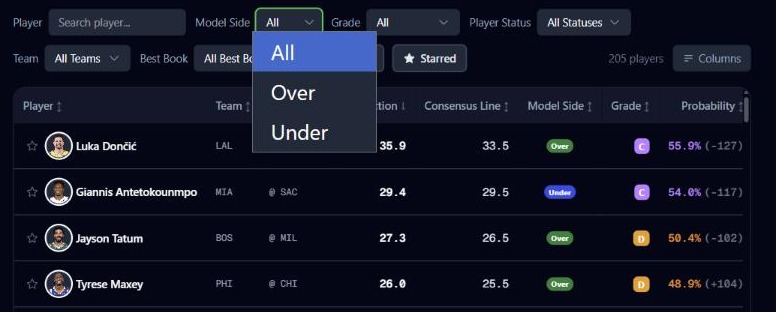
Model Side offers All, Over and Under.
Grade picks one or several letters.
Player Status narrows by injury designation.
Team narrows to one or more teams.
Best Book narrows to rows where a chosen sportsbook has the best price.
Tags filters to players who match your custom tags, matching any or all of the tags you pick.
Cashed shows only rows where the model's side already cashed.
Starred shows only the plays you have starred.
Your filter and column choices are remembered on your next visit; the search and the game chips are not, because they describe one slate. The Columns menu shows and hides any column, and a count shows how many players are on screen.
The Threes and Stats tabs
Threes is the same board for made threes. Its content is for subscribers; others see a subscribe prompt in the tab.
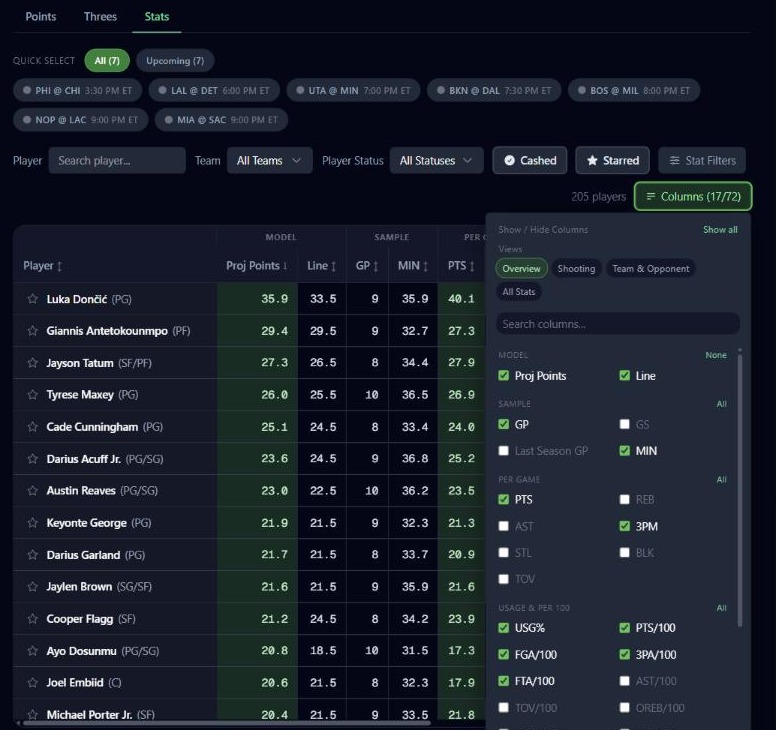
Stats lists the season numbers behind each projection for the same players. It has column presets, a Columns menu, and a stat filter builder where you can add your own conditions. Cells are shaded relative to the other players in scope, so the highs and lows stand out at a glance.
The player modal
Click a player's name to open the modal. Its tabs are:
Homer AI: the written read for the player, when one is available.
Usage, Matchup and Stats: how the player is used, how he lines up against tonight's opponent, and his numbers.
Log: his recent games one by one.
Shot Chart: where he shoots from.
With/Without: a with-and-without view of his teammates.
Trend: how he has done against the line.
Odds: every sportsbook's price side by side.
Open the feature: Points Model
Must be 21 or older. Please play responsibly.