

The 2026 season home-run landscape is taking shape, and the numbers tell a clear story before you dig into the tables below. Night games have outpaced day games at 2.322 HR per game versus 2.155, while Monday has quietly been the most homer-friendly day of the week at 2.492 per game — a gap worth keeping in mind as you scan the day-of-week breakdown. The season leaderboard, last-seven-days hot list, first-inning leaders, and top individual weeks are all here to show who has been doing the damage and when.
The section drawing the most attention may be the zone-5 "meatball" rates, which flag the pitchers leaving the most hittable pitches in the heart of the zone. Cole Wilcox leads that group at 10.8%, with Bennett Sousa and Trevor Megill right behind at 10.5% each, followed by Aaron Bummer at 10.0% and Yerry De los Santos at 9.9%. Everything below is descriptive of what has happened through today — use it to understand the trends driving the numbers, not as a forecast of what must come next.
Home runs by day of week
Which weekdays have produced the most home runs per game.
- MondayHR/game: 2.49HR: 653Games: 262
- FridayHR/game: 2.38HR: 933Games: 392
- TuesdayHR/game: 2.29HR: 848Games: 371
- ThursdayHR/game: 2.28HR: 514Games: 225
- SundayHR/game: 2.26HR: 905Games: 401
- SaturdayHR/game: 2.24HR: 900Games: 401
- WednesdayHR/game: 2.18HR: 822Games: 377
Top weeks for home runs
The season's biggest home run weeks.
- 16/29/2026 - 7/5/2026HR: 270HR/game: 2.87Games: 94
- 26/8/2026 - 6/14/2026HR: 259HR/game: 2.91Games: 89
- 35/25/2026 - 5/31/2026HR: 249HR/game: 2.65Games: 94
- 47/6/2026 - 7/12/2026HR: 247HR/game: 2.55Games: 97
- 54/20/2026 - 4/26/2026HR: 242HR/game: 2.60Games: 93
Day vs night
How the home run rate splits between day and night games.
- DayHR/game: 2.15HR: 1,957Games: 908
- NightHR/game: 2.32HR: 3,603Games: 1,552
Pitcher meatball leaders
Pitchers grooving the most zone-5 meatballs, and the most home runs allowed on them.
Highest meatball rate
- 1
 Cole Wilcox (SEA)Meatball%: 10.8%Meatballs: 53Pitches: 492
- 2
 Bennett Sousa (HOU)Meatball%: 10.5%Meatballs: 56Pitches: 533
- 3
 Trevor Megill (MIL)Meatball%: 10.5%Meatballs: 93Pitches: 886
- 4
 Aaron Bummer (KC)Meatball%: 10.0%Meatballs: 33Pitches: 329
- 5
 Yerry De los Santos (NYY)Meatball%: 9.9%Meatballs: 36Pitches: 362
- 6
 Anthony Bender (MIA)Meatball%: 9.9%Meatballs: 54Pitches: 543
- 7
 Bryan Hudson (CWS)Meatball%: 9.9%Meatballs: 105Pitches: 1,063
- 8
 Beau Brieske (DET)Meatball%: 9.8%Meatballs: 38Pitches: 387
- 9
 Sammy Peralta (LAA)Meatball%: 9.8%Meatballs: 39Pitches: 400
- 10
 José A. Ferrer (SEA)Meatball%: 9.7%Meatballs: 107Pitches: 1,101
Most HRs allowed on meatballs
- 1
 Kumar Rocker (TEX)HR on meatballs: 10Meatballs: 170
- 2
 Ian Seymour (TB)HR on meatballs: 10Meatballs: 193
- 3
 Aaron Nola (PHI)HR on meatballs: 9Meatballs: 179
- 4
 Colin Rea (CHC)HR on meatballs: 9Meatballs: 158
- 5
 Seth Lugo (KC)HR on meatballs: 9Meatballs: 236
- 6
 Tomoyuki Sugano (COL)HR on meatballs: 9Meatballs: 189
- 7
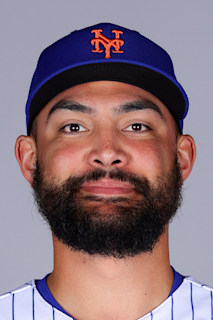 Sean Manaea (NYM)HR on meatballs: 9Meatballs: 203
- 8
 Zack Littell (ARI)HR on meatballs: 9Meatballs: 140
- 9
 Zebby Matthews (MIN)HR on meatballs: 9Meatballs: 165
- 10
 Jeffrey Springs (ATH)HR on meatballs: 8Meatballs: 162
Hitter meatball leaders
Hitters seeing the most zone-5 meatballs, with their home-run rate on them.
- 1
 Ben Rortvedt (LAD)Meatballs seen%: 16.0%HR rate vs meatball: 0.0%Meatballs: 16
- 2
 Michael Helman (TEX)Meatballs seen%: 14.2%HR rate vs meatball: 0.0%Meatballs: 16
- 3
 Andrew Pinckney (WSH)Meatballs seen%: 11.9%HR rate vs meatball: 7.7%Meatballs: 13
- 4
 Raynel Delgado (HOU)Meatballs seen%: 11.4%HR rate vs meatball: 0.0%Meatballs: 15
- 5
 Bryan De La Cruz (PHI)Meatballs seen%: 10.6%HR rate vs meatball: 0.0%Meatballs: 36
- 6
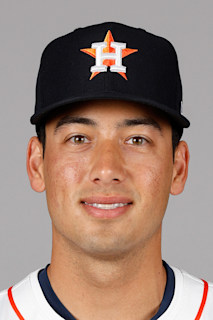 Shay Whitcomb (SF)Meatballs seen%: 10.4%HR rate vs meatball: 4.3%Meatballs: 47
- 7
 Angel Genao (CLE)Meatballs seen%: 10.2%HR rate vs meatball: 0.0%Meatballs: 53
- 8
 Romy Gonzalez (BOS)Meatballs seen%: 10.1%HR rate vs meatball: 0.0%Meatballs: 29
- 9
 Ethan Salas (SD)Meatballs seen%: 10.1%HR rate vs meatball: 6.7%Meatballs: 15
- 10
 Jesus Rodriguez (SF)Meatballs seen%: 10.1%HR rate vs meatball: 0.0%Meatballs: 21
Always remember that betting involves risk. These are model-driven analyses provided by an AI for informational purposes only. They do not represent direct betting advice or a guarantee of any outcome. Please gamble responsibly; if you or someone you know has a gambling problem, call 1-800-GAMBLER.